Introduction
This project explores 20 years of NFL data, featuring deep dives into league-wide and team-specific trends throughout the regular season. It utilizes Excel and data visualization concepts to draw meaningful conclusions.
Analysis
Does the amount of rush attempts affect the number of games the Green Bay Packers lose?
This question investigates the relationship between the volume of rushing plays and team success for the Green Bay Packers from 2003 to 2023. It tests a fundamental principle of football strategy: “establish the run to win”. Conventional logic suggests that running the ball controls the clock and protects the lead, which should theoretically reduce losses. 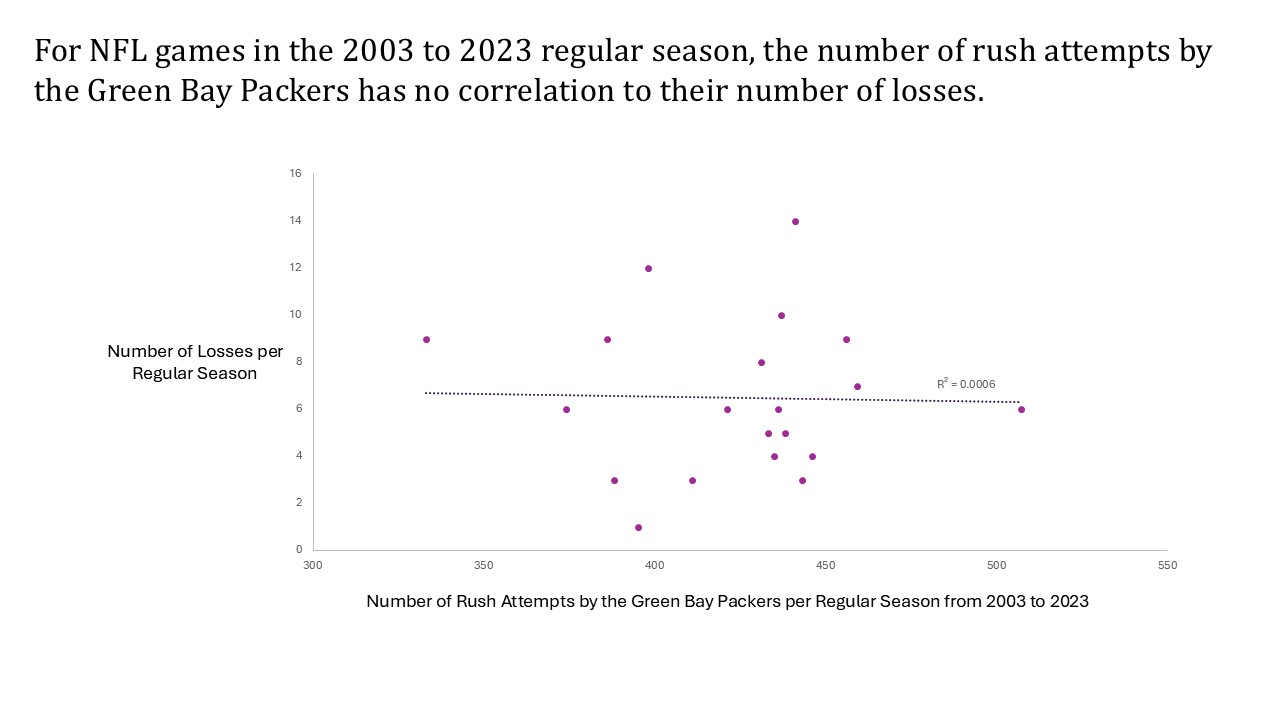 To investigate the potential correlation between the Packers’ rush attempts and losses, our team began by filtering the Excel dataset to include only the Green Bay Packers. Then, using a pivot table, we set our row labels to the amount of rush attempts per season, with the corresponding values being the number of losses. We decided to use a scatter plot because it effectively displays the correlation between these two variables. After plotting the points, we superimposed a linear trendline with an \(R^2\) value of 0.0006. This means that only 0.06% of the data is explained by the trendline, leading us to conclude that the number of rush attempts does not correlate to the number of losses for the Green Bay Packers from 2003 to 2023.
What is the distribution of offensive passing yards in the 2019 NFL Regular Season?
This question analyzes the lanscape of the NFL’s passing offense during the 2019 regular season. By visualizing the distribution of passing yards, we can determine what constitutes a “typical” passing performance versus an outlier performance for the season. 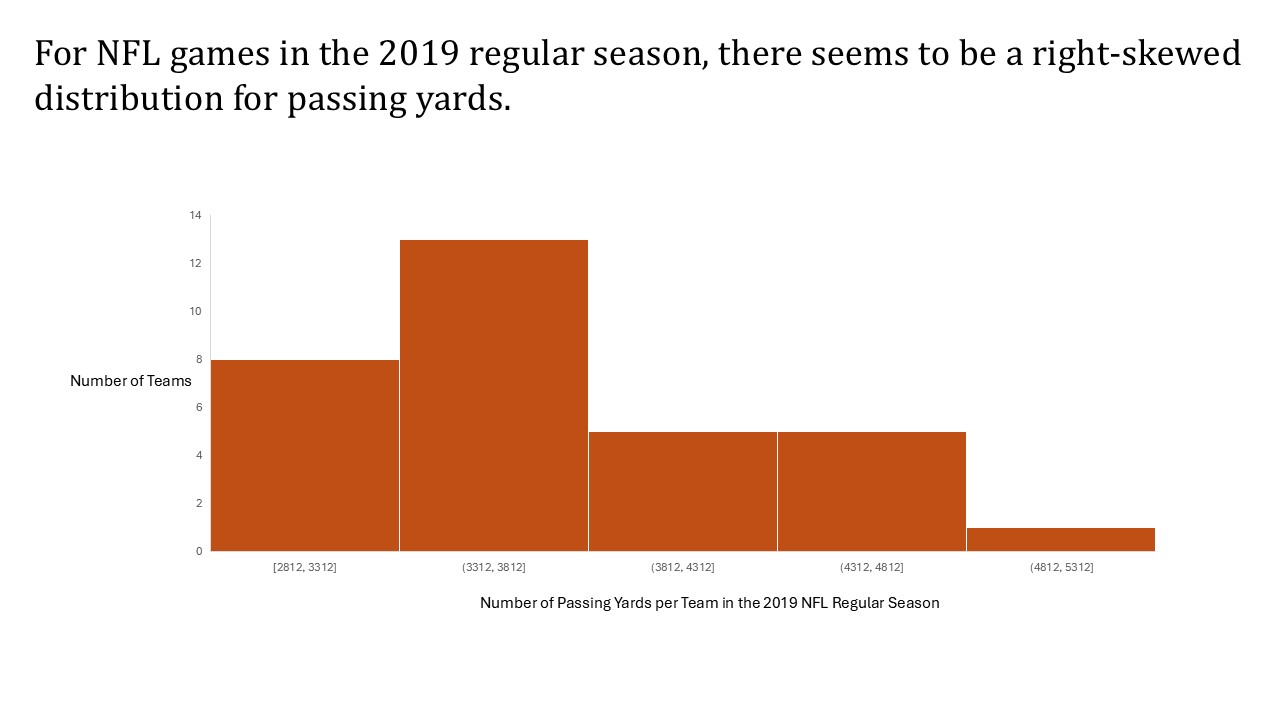 To investigate the distribution of passing yards in 2019, we first filtered the data to only show statistics from that year. Then, by copying and pasting the passing yards column into another sheet, we were able to create this histogram chart with appropriate bin sizes clearly showing a right skew.
What is the best rushing team in the NFC North Division in 2023?
This question compares the total rushing yardage of the four teams in the NFC North Division (Packers, Vikings, Bears, and Lions) during the 2023 season. We found this question interesting because the NFC North is often called the ‘Black and Blue Division’ due to its reputation for grit and toughness. We wanted to see which franchise fielded the most dominant ground attack in a division historically known for physical, cold-weather football. 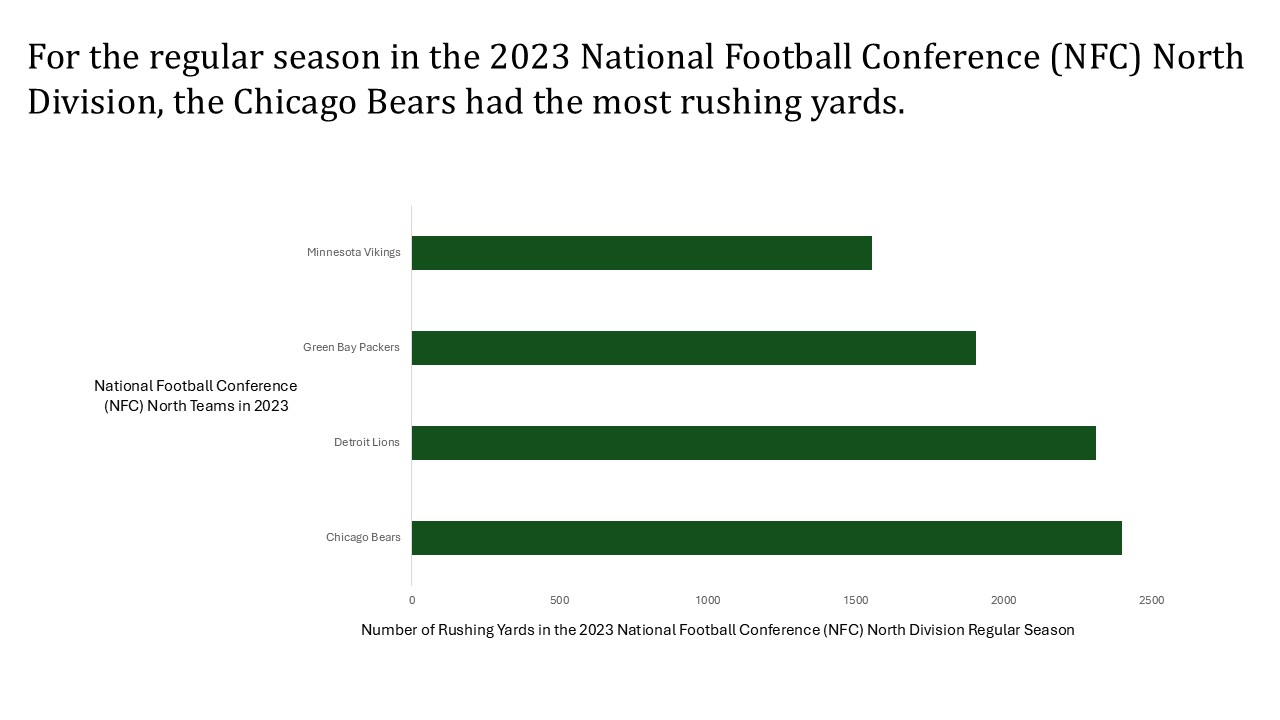 The first step in cleaning the data was to filter the year to 2023 and select only the teams in the NFC North Division. Then, utilizing a pivot table, we set ‘Teams’ as our row labels and ‘Rush Yards’ as our values. We used this data to generate a bar chart. To improve visual clarity, we removed unnecessary labels from the x-axis and ordered the teams from least to greatest (top to bottom).
Has the Dallas Cowboy’s passing game improved from 2003 to 2023?
This analysis tracks the trajectory of the Dallas Cowboys’ passing game over two decades. We found this question interesting for several reasons, one being that it is Matthew’s favorite team. More importantly, the Cowboys are one of the most scrutinized teams in sports, and this timeline covers the eras of three distinct franchise quarterbacks: the end of the post-Aikman carousel, the Tony Romo era, and the current Dak Prescott era. 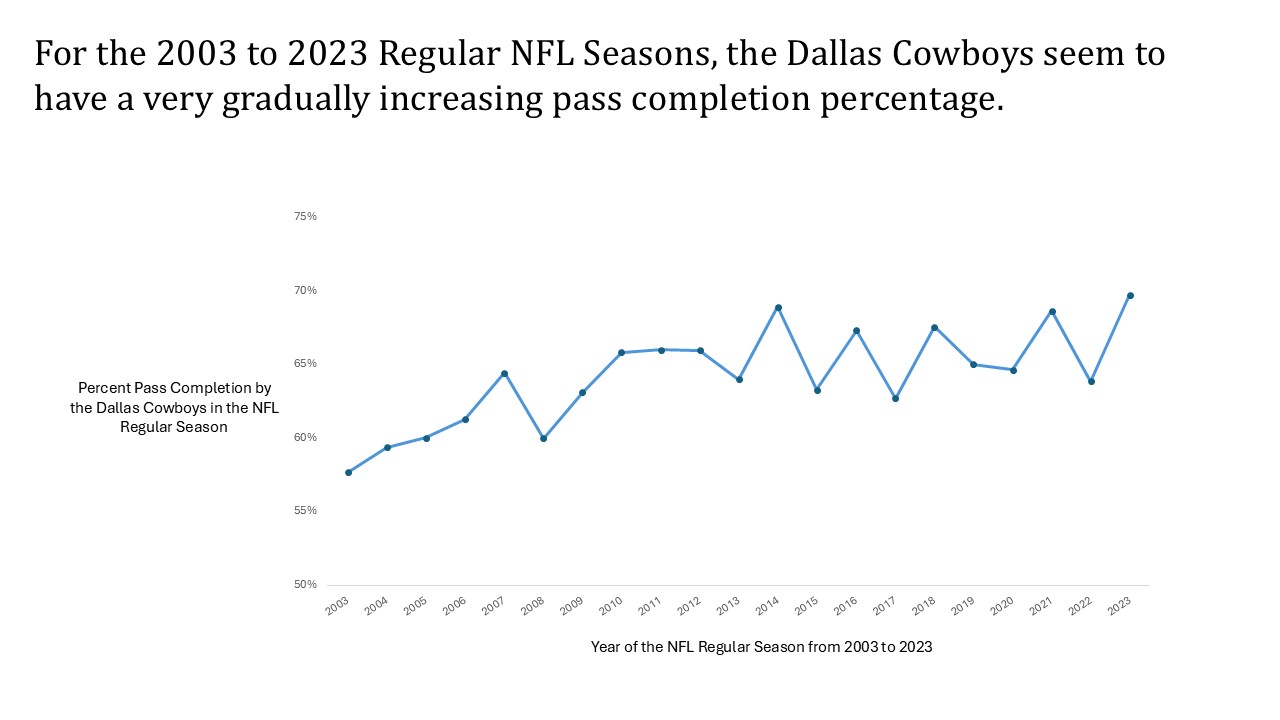 To prepare the data for graphing, we immediately used a pivot table. We filtered for the Dallas Cowboys and set the ‘Year’ as our row label. To find the completion rate, we pulled the sum of completed passes and attempted passes for each year. Then, in a separate column, we used the equation =(passes completed/passes attempted) to perform the calculation. After creating the time-series plot, we adjusted the y-axis to a range of 50%-75% to better visualize the differences between years and ensured the markers for each data point were clearly visible.